Learning Journey and Reflections on R/Medicine 2022 Conference Part 2
By Jeremy Selva in R/Medicine 2022
August 23, 2022
Introduction
This is a continuation about my learning journey in R/Medicine 2022. This section covers Day 3 and 4 of the conference. As the videos of the presentation are not available, the writings made are based on my memory. If there are any mistakes, kindly let me know.
Day 3
Keynote: Quarto
Day 3 of the conference started with a keynote, presented by JJ Allaire, founder of RStudio, which soon will be become Posit.
The topic was about Quarto, an open source data publishing tool, used to render narrative text, pictures and code chunks into documents, web pages and so much more.
While some may point out that this is similar to R Markdown. The presentation mainly covered features that can be done easily using Quarto (but hard in R Markdown) such as complicated figure layouts, callout blocks and support for embedding Mermaid and Graphviz diagrams.
This is similar to what Tom had covered during the Quarto workshop. It is comforting to know that the Poxit team is currently working on adding “track changes” feature into Quarto similar to what Microsoft Word can do. This could make collaboration of Quarto documents between different users less painful, especially with those who don’t know Git.
- 📝 Slides
Interactive web tools using R and Run Chart Plot
The first group of talks can be summarised as ways in which R can be used to create different interactive web tools, followed by an introduction to an R package to create run chart plots.
Piru Perampalam from Procogia, maintainer of a browser-based tool BEAVR,shared about the complexity of a cloud-based bioinformatics pipeline, demanding not just high computing resources and time but also the flexibility to handle unique experiments that requires different programming platforms and tools. Nevertheless, the team was able to overcome the challenges by creating a well-balanced web tool that had a user friendly GUI interface that tracked user choices, ensuring reproducibility.
Jeremy Selva covered how interactive plots created using Plotly can be organised and distributed to collaborators using trelliscopejs.
- 📝 Slides
- 📝 Quarto Example
Anastasiia Kostiv uses R Shiny dashboard to highlight the usefulness of geospatial data in understanding the spread of a disease (unfortunately I cannot remember) and places where healthcare support is greatly needed. She also showed the flexibility of R in creating customised pdf reports that suit the needs of her collaborators through the use of css files.
Moving away from the topic of interactive plots,
Robert Lobato presented how he used the R package
runcharter to plot a time series run chart plot to see if a recent quality improvement program is helping staff members improve their work performance. The R package
runcharter was also presented during R/Medicine 2020 conference by the maintainer
John MacKintosh. Here is the
link to John’s presentation.
- 📝 Slides
CONSORT Diagrams, Applied Epi and Spatial Transcriptomics
The next group of talks were about CONSORT Diagrams, a non-profit organisation called Applied Epi and applied spatial transcriptomics in the brain.
Nick Barrowman showed how the R package
vtree was able to not only draw beautiful CONSORT flow diagram but more importantly, error-free and reproducible as well.
In addition, the R package
vtree could also be used to see hidden patterns during exploratory data analysis. It was striking that
vtree was also able to give statistical summary on continuous variable as well.
The talk ended with a fruitful sharing from the audience, highlighting alternative packages that made CONSORT flow diagram. One of them is
ggconsort, which was
presented during the R/Medicine 2021 conference and used in
R Workflow by Frank Harrell.
Neale Batra from Applied Epi shared his journey when he was working on the Epidemiologist R Handbook project.
The Epidemiologist R Handbook Project team strived to work on tools to make R more accessible to those working in Applied and “field” epidemiology, by providing them training and establishing workflows and standardised methods for such analysis.
The team is currently working on translating the handbook into several other languages and adding more case studies to give epidemiologist more hands-on practice.
Leonardo Collado-Torres showcased his lab’s research on spatial transcriptomics of the brain. A few resources were mentioned such as
spatialLIBD,
spatialExperiment,
biocthis and an ebook titled “Orchestrating Spatially-Resolved Transcriptomics Analysis with Bioconductor” or
OSTA in short. One thing that surprised me was his sharing on how openly sharing data can help to accelerate not just science but the time took to publish the paper as well.
- 📝 Slides
Clinical Data Reporting
For the next set of talks, majority of them revolved around clinical data reporting as well as some example case studies in R.
Things started off with a lightning talk by
Raymond Balise. Raymond is known for being the maintainer of
tidyREDCap and
rUM.
In this lightning talk, attendees were introduced to the
rUM package, used to help R users create a research project template easily without spending too much time choosing the right YAML and knitr code chunk parameters in a newly created
R Markdown document. Moreover, the package could also create an “aggressive” .gitignore to prevent users from making accidental data breach when pushing their code to GitHub.
In its latest version, the
rUM package also supports Quarto documents.
- 📝 Slides
The following speech was from Paul Harris, one of the founders of REDCap (Research Electronic Data Capture). He introduced a new REDCap module called the Clinical Data Interoperability Services (CDIS) which could be used to collect data from electronic health records (EHRs) into the REDCap database.
After Paul’s talk, Jeremy Michel from the
Children’s Hospital of Philadelphia (CHOP) gave a success story of how he managed to create a reliable immunisation status report with the help of the
data.table R package. He showed some coding examples of how validation and complex conditional filtering can be done using this R package.
Another success story came from Nathan Breit, whose team created an automated reporting system capable of creating numerous dashboard reports, such as scheduling for staff, accessing workflow changes and blood draw forecasting. The main body of the presentation consisted of a gallery of such reports. Credit goes to the R package
flexdashboard for making this possible.
- 📹 Video
Shannon Pileggi and Daniel Sjoberg introduced their newly created package gtreg. This R package is used to create summary report tables of adverse events easily.
- 📝 Slides
Treatment timelines, Mediation Analysis and Randomization
Treatment timelines are useful in exploratory longitudinal survival analysis to better monitor how a patient is doing when being treated for an illness.
Katherine Hoffman taught the attendees how to create treatment timelines or “swimmer plots” using
ggplot2.
Penalised mediation models could be useful in helping biostatisticians select useful variables in a given biological model.
Jason Sinnwell presented one of his R package
regmed used to create penalised mediation model for the following cases:
-
One exposure, multiple mediators, and one outcome variable
-
Multiple exposures, multiple mediators, and multiple outcome variables
-
📝 Slides
The next speaker was from
Michael Kane, one of the founders of R/Medicine. He was supposed to speak about the R package
ctrialsgov, a tool for querying information from the U.S. National Library of Medicine’s Clinical Trials
database. Michael was intending to share how the R package can be used to investigate the trends of drug development in the US. Unfortunately, the connection got cut off in the midst of his presentation. A video recording will be provided in the future.
Day 3 of the conference ended with Steven Schwager, providing a light summary of the common types of randomisation used in a clinical trial. They are complete randomization, stratified permuted block randomisation and covariate-adjusted randomisation.
A few useful R packages were shared
blockrand
Minirand,
SeqAlloc
Day 4
Keynote: R Workflow
Frank Hawell kick-started the keynote with a walkthrough of the latest version of the ebook R Workflow. This ebook is meant to guide people using R to create decent reports (in Quarto) that are computationally reproducible and comprehensive to a general audience. There is even a chapter dedicated to just report formatting.
Here are some things that are unique to this ebook that most data science book don’t provide
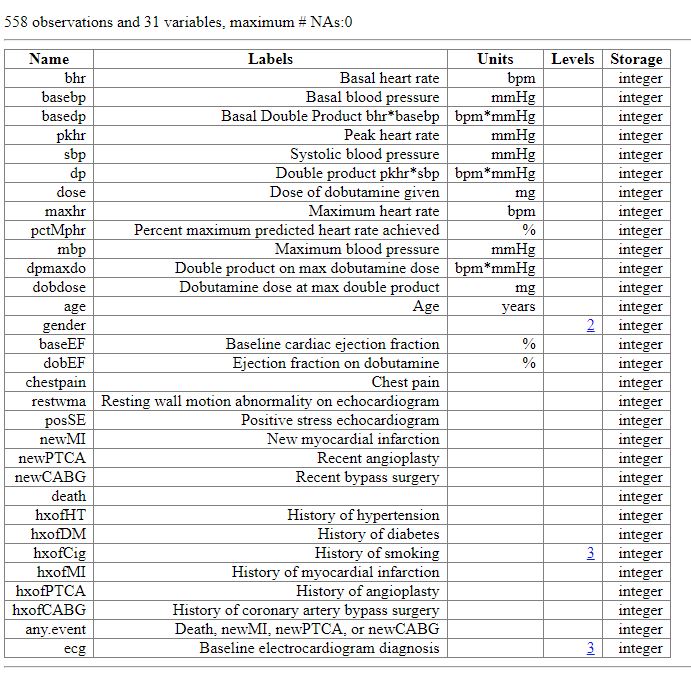
- Creation of a data dictionary or metadata in Chapter 5
- Usage of R package
data.tableto perform clean, merge and summarise data in Chapter 10-12
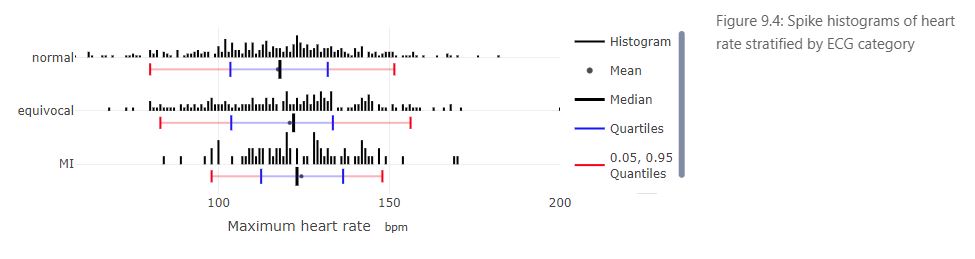
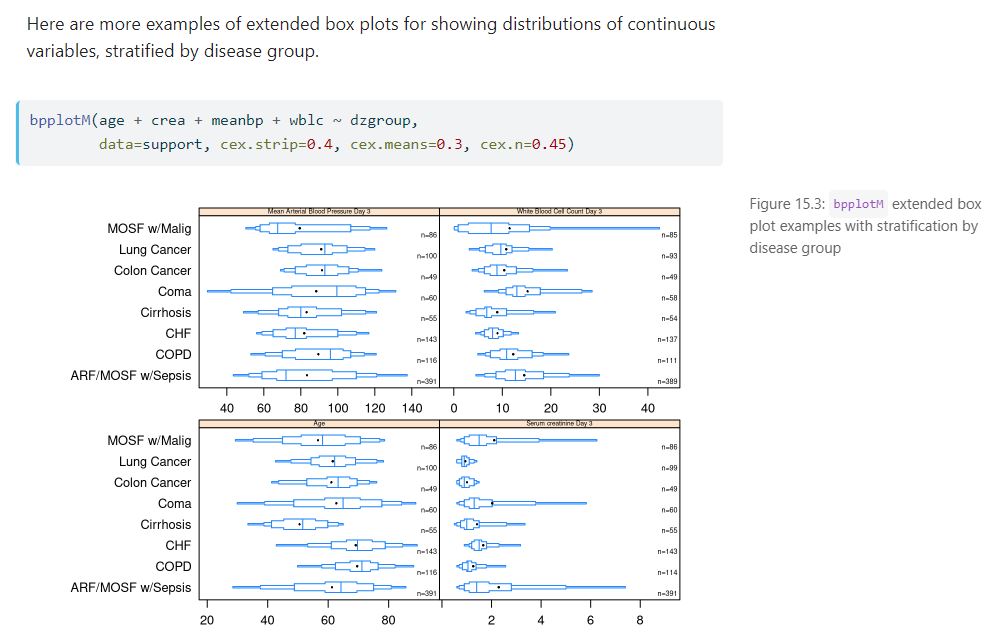
- Usage of stratified spike histograms
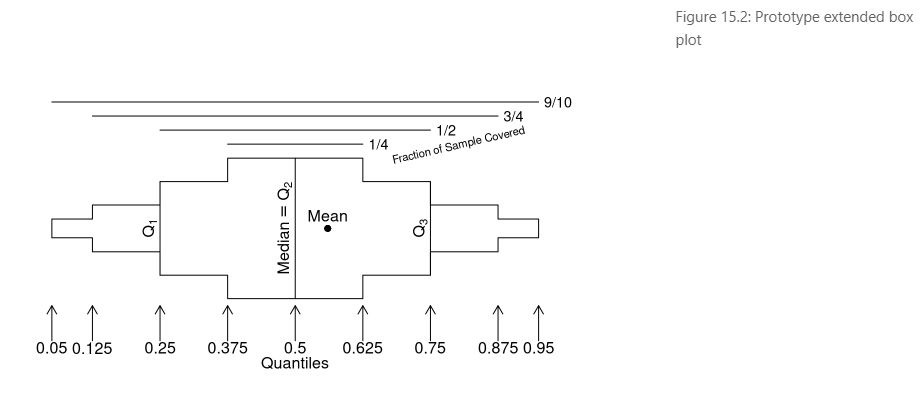
- Usage of extended box plots
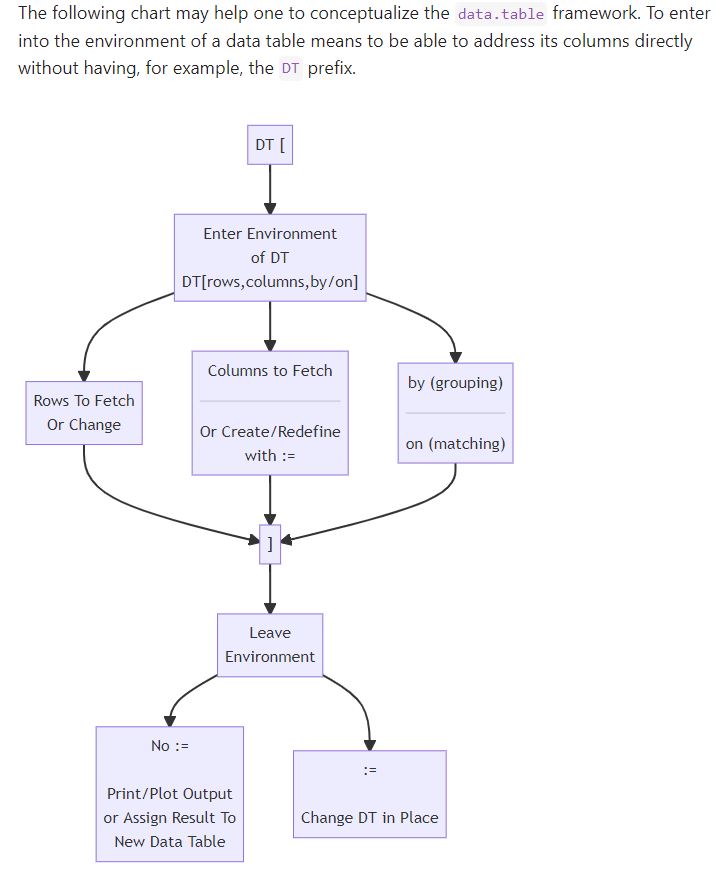
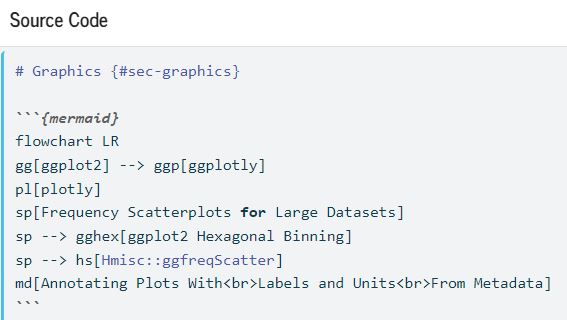
For each section, readers can see the source code used to create the section’s content, such as the code to create this flow diagram using Mermaid by clicking on the “Code” button.

Whether you have used R frequently or just starting to use it, this book is useful as there is always something new to learn from its content.
Wrangling Big Medical Data, 📦 {censored}, Application of R in Industry
Peter Higgins kept the audience glued to his presentation as by giving a story of his own investigation to find out how four physicians received a yearly payment of over $1 million, according to this paper.
Peter obtained the data from the CMS (Center for Medicare and Medicaid Services) website but was hit with a stumbling block to process that data as the data were too large for R to handle through conventional methods. Thankfully, with the help of the R community on Twitter, he was able to proceed using Apache Arrow and DuckDB. Eventually, he was able to identify how the four physicians received such a high amount of payment. However, I would not wish to spoil the ending. Take a look at his slides to find out.
A myraid of resources was also shared.
- 📝 Getting started with Apache Arrow by Danielle Navarro
- 📝 Apache Arrow Workshop Notes
- 📝 Arrow Cheatsheet
- 📹 Doing More with Data: An Introduction to Arrow for R Users by Danielle Navarro
- 📹 Efficient Data Analysis on Larger-than-Memory Data with DuckDB and Arrow by Thomas Mock
An additional side note. Peter Higgins is also the author of the ebook Reproducible Medical Research with R and the new chair of R/Medicine 2023
- 📝 Slides
After an engaging talk,
Hannah Frick presented an R package from the
tidymodels family called
censored.
This R package aimed to create a consistent interface for survival models, helping users to create censored regression and survival analysis in a more streamline approach.
- 📝 Slides
Asmae Toumi, Director of Analytics and Research at PursueCare shared how her team used data and R to understand trends in opioid misuse and overdose so that better care can be delivered to the patients and those affected by the opioid crisis. What we can learn form there is the data science is not just about dealing with data but also being able to determine and anticipate the needs of the clients or stakeholders and requires the flexibility to take multiple roles.
Moreover, Asame shared some useful resources that contributed to the team’s success such as
Building a team of internal R packages by Emily Riederer, use of
tidyverse and
tidymodels to make survival analysis predictions,
targets to create reproducible pipelines, publishing results and reports using
RStudio Connect.
More Clinical Data Reporting and Reflections from a previous clinical nurse.
The next group of talks was mainly the return on the applications of R in clinical data reporting (but the focus was more on the application of Shiny) as well as a speech to encourage more people with nursing background to learn R.
Marcin Dubel started of by sharing some useful tips to create a Reproducible R Shiny Project Environment. Here are just some notes that I have taken:
- If possible, keep data files and
.Renvironfiles out of the code repository. - Avoid local paths, use relative paths instead.
- Use renv and Docker to save your computing environment.
- When creating a web application, consider creating
- Production Environment
- Test Environment
- Development Environment
- Sandbox Environment
- Offline Environment
- Use a YAML file to set hardcoded configurations.
- Setup a Continuous Integration first before adding test units
- Use a data validation tools (like
data.validator) andtargetsto check business logic
The following lightning talk is from Jaclyn Janis who gave a plea for nurses to acquire some basic data science related skill sets and R is an effective way to make this possible.
Since nurses had access to a lot of clinical data and had a wide domain knowledge about the clinical data, Jaclyn argued that the quality of the data would improve if they were equipped with tools (besides paper and Excel) that could help save time and effort in processing the data.
As clinical data become more vast and complex, it will be more beneficial for them to use R as it is easier to create simple reports compared to other programming languages. Jaclyn Janis shared how overjoyed she felt when she managed to create a report using R Markdown. Nevertheless, the speaker acknowledged that convincing nurses to learn new things was hard as they had a lot of things to do.
Jaclyn ended her talk by asking for more nurses to reach out and network with her to share their experiences and difficulties dealing with clinical data, especially those who were successful in using R in their work.
- 📧 Email: jaclyn.janis@rstudio.com
Gloria Kang from the Centers for Disease Control and Prevention (CDC) gave an overview of her working experiences in a few projects, which she had received little data but needed to provide the results quickly to state holders and decision makers.
Below are the links to these projects’ results.
Returning back to the use of Shiny, Lucy D’Agostino McGowan presented a Shiny Application called CONTESSA (Contact Tracing Evaluation and Strategic Support Application). This application is used to monitor and evaluate the impact of Covid 19 Test-Trace-Isolate program implemented in the US.
The R package
tti was used to calculate the virus reproductive number, defined as the number of onward transmissions an infected individual is expected to make given the current immune status of the population and implemented control measures. To see if the Test-Trace-Isolate program is working, we want the reproductive number to decrease to a low number over time (given some input parameters)
CONTESSA provides a user-friendly interface for analyst to keep in the parameters and plot the reproductive number results over time. From the calculated reproductive number, the tool is able to predict the percentage of the community that will be isolated or quarantined.
Lihai Song’s team contributed another Shiny application to automate regression and survival analysis and reporting with minimal typing from the user.
Effective R Teaching in biomedical sciences, Tidying REDCap data and Application of Tidymodels
The next talk was from Carrie Wright from the Informatics Technology for Cancer Research ( ITCR) Training Network ( ITN). The goal of ITN is to create a support cancer researchers with data science training through resources, technology and events.
One of their most recent projects was the development of OTTR (Open-source Tools for Training Resources) to assist teachers, who had written courses in R Markdown files, to be able to publish and maintain courses on multiple learning platforms (Bookdown, Cousera and Leanpub).
ITN is also looking for people to join them.
The baton was then passed to
Stephan Kadauke who presented on an R package that he was working on called
REDCapTidieR.
While
REDCapR was able to interact with REDCap and extract the data, it had its limitation. For example, when it comes with data with repeated measurements and longitudinal projects,
REDCapR returned a sparse data set with a lot of NA with unmeaningful rows.
REDCapTidieR resolves this issue by organising the sparse data and output them into a tibble with two rows. One row with the repeating data and the other with a non-repeating data. A key column was created to connect the non-repeating data with the repeating data.
Next, Garrett Grolemund, author of the ebook R for Data Science, presented on ways to effectively teach others to obtain data science skills through the use of lessons, daily practice, project milestones, group sharing and mentor meetings.
To spread the use of these effective teaching techniques, the RStudio Academy was created. They are currently looking for mentors to assist in their teaching program.
Here is the link if you are interested in being a RStudio Academy Mentor.
We returned to the application of tidymodels as Allen Lee from the University of Michigan showed how it can be used to identify patient with high risk of Clostridiodes difficile Infection.
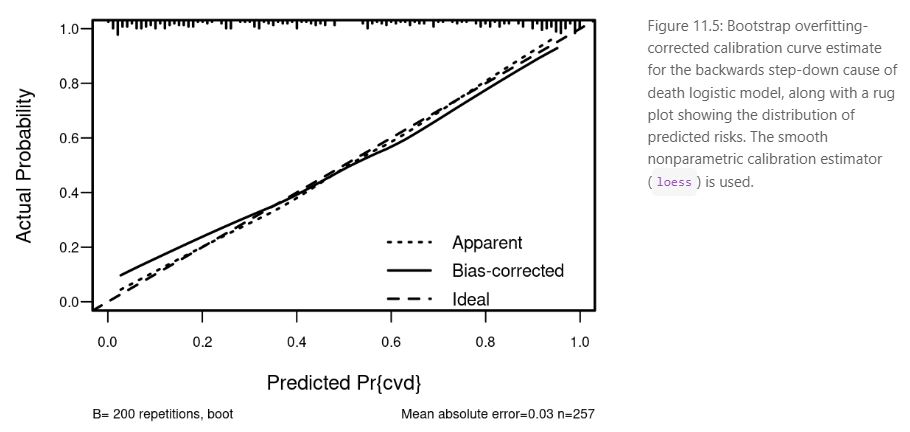
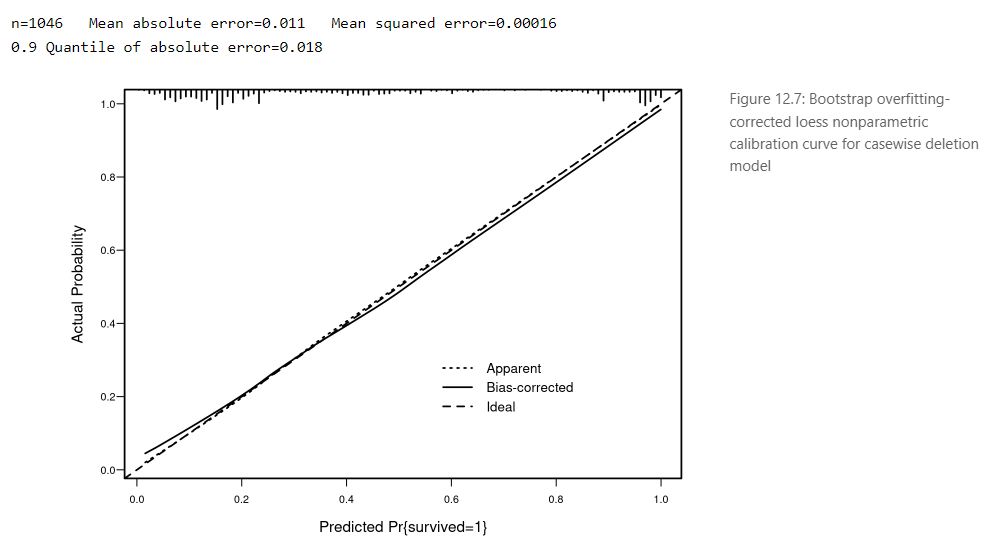
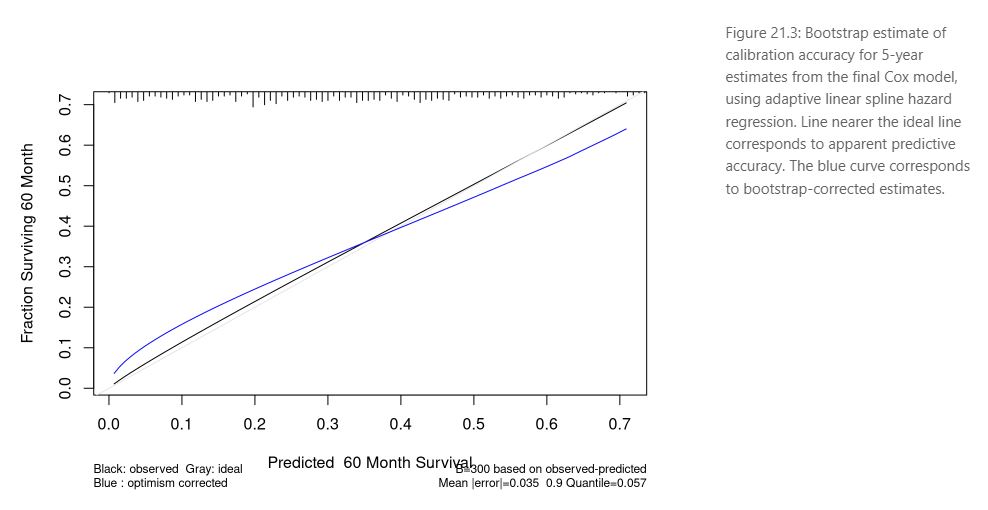
The presentation ended with a short sharing from the attendees highlighting the limitations of the ROC curve to evaluate a prediction model and suggestions to use a high resolution calibration curve

like these examples from the ebook Regression Modeling Strategies:
R in Transcriptomics and Pharmacometrics Data
The last few talks for the conference were about the use of R in transcriptomics and pharmacometrics data
Daniel Holmes from the University of British Columbia presented how he was able create a pipeline from PCR readings collected from several Hamilton Instruments to an R Shiny application showing quality control results. A feat that required a lot of patience and hard work to achieve
Lukas Weber, author of the ebook
Orchestrating Spatially-Resolved Transcriptomics Analysis with Bioconductor (OSTA) presented a new package called
nnSVG used to identify and rank spatially variable genes in spatial transcriptomics data. For those new to this kind of work, here is a link to an open access
review paper
- 📝 Paper
Lastly, Seth Green from the Metrum Research Group praised the usefulness of Quarto to create a beta preview of their ebook Metrum Research Group Ecosystem (MeRGE) Expo.
This ebook contained a walkthrough of how to do a population pharmacokinetic (pop PK) modeling and simulation (M&S) analysis that is traceable and reporducible. It also showcased some
useful R package made by them that were free and open source such as
pkgr and
bbr.
The speaker also gave some useful tips in Quarto such as the use of the _variables.yaml file to create
dynamic documents that was able to give consistent descriptions and links to R packages, scripts and related articles.
Since most of their R packages are related to pharmaceutical research, it will be great if the pharmaverse team is aware of their presence.
Conclusion
R/Medicine 2022 indeed had provided many inspiring information to the attendees with its beneficial workshops, stellar keynotes and useful (and even inspirational) talks at an economical price. It is highly recommended if you are able to fit your schedule with the conference timeline. I am grateful to the organising team for giving me a chance to give a lightning talk.
Wishing all the best to the next organising team under the leadership of the new chair Peter Higgins.
If you wish to help up with the planning and preparation of future R/Medicine conference, do send an email to r-medicine-conf@r-consortium.org to indicate your interest and desire to help.